Hi! I'm Natalie Schultz-Henry.
I analyze data and design tools to help people understand it.
Scroll down to see some of my projects.
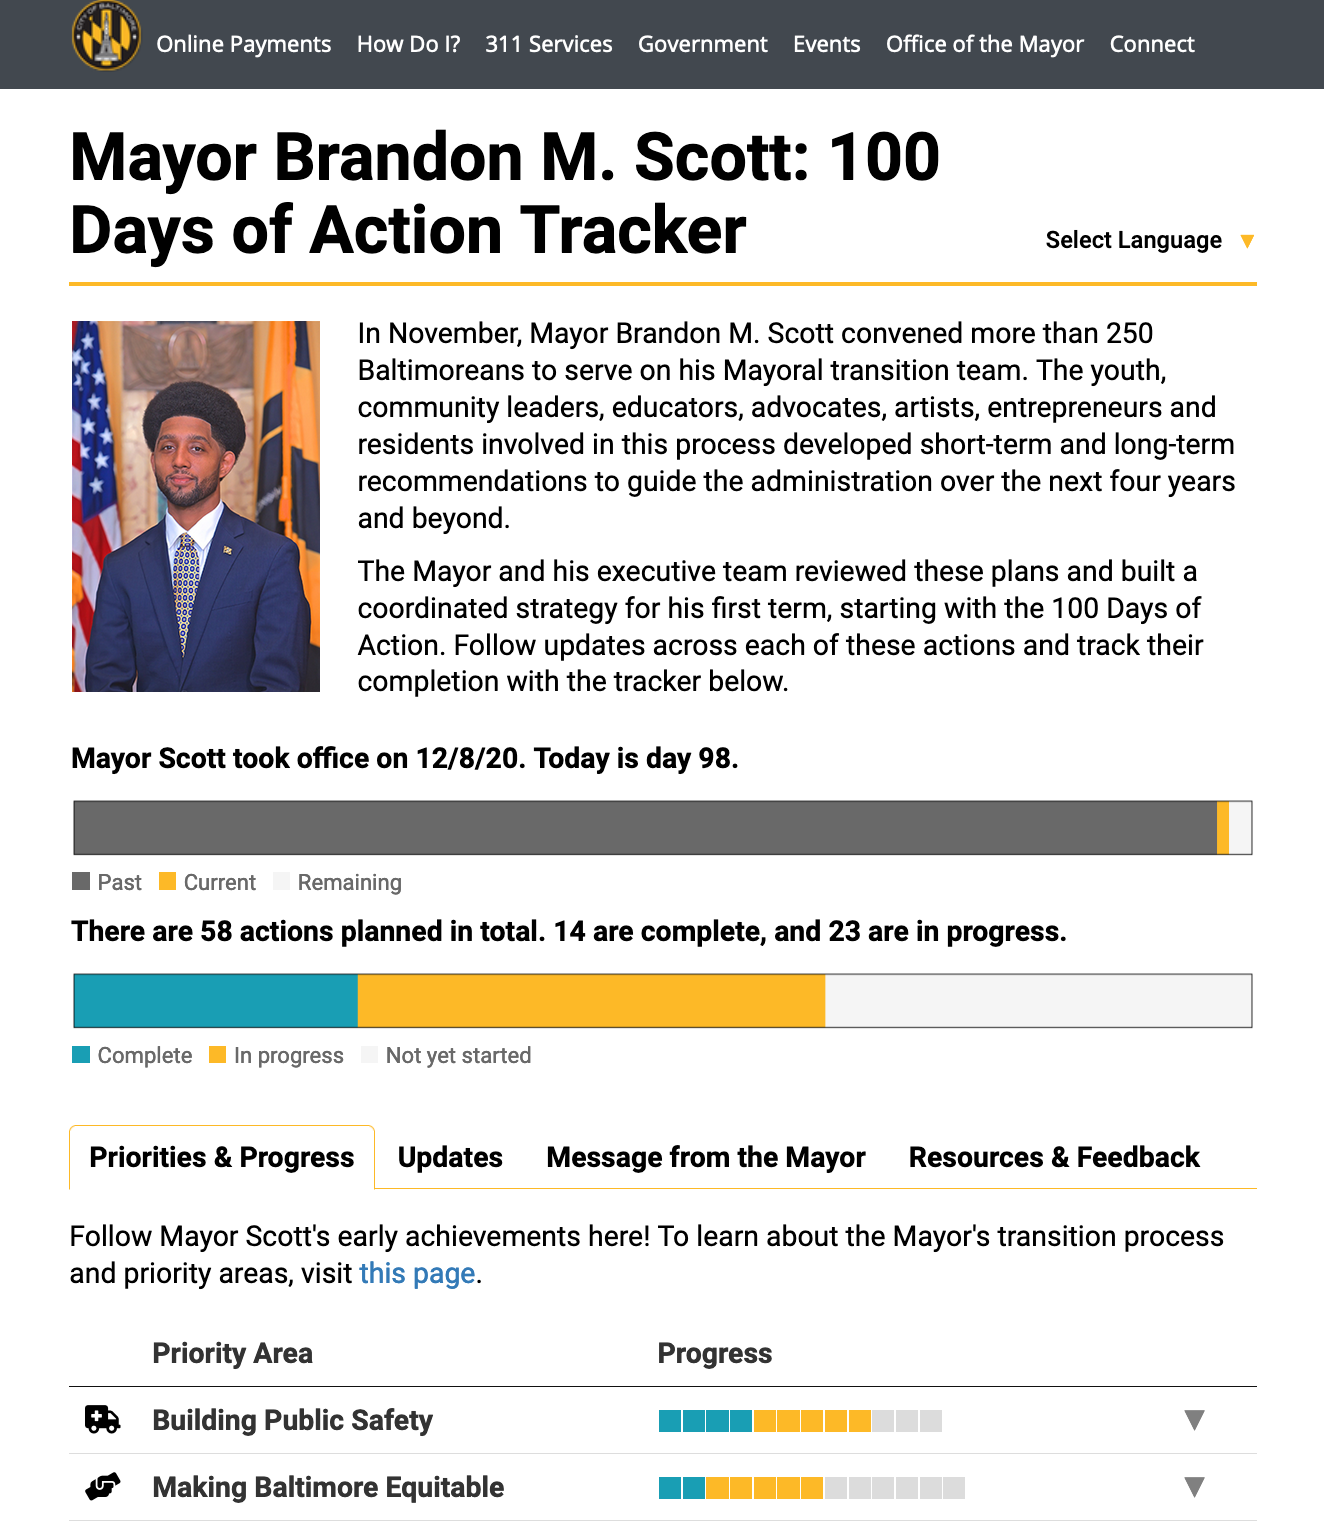
After Mayor Brandon Scott's inauguration, I served on an OPI team that created a public tool for tracking the Mayor's progress toward delivering on several short-term promises. We designed the tracker through an iterative process and developed it using R Shiny.
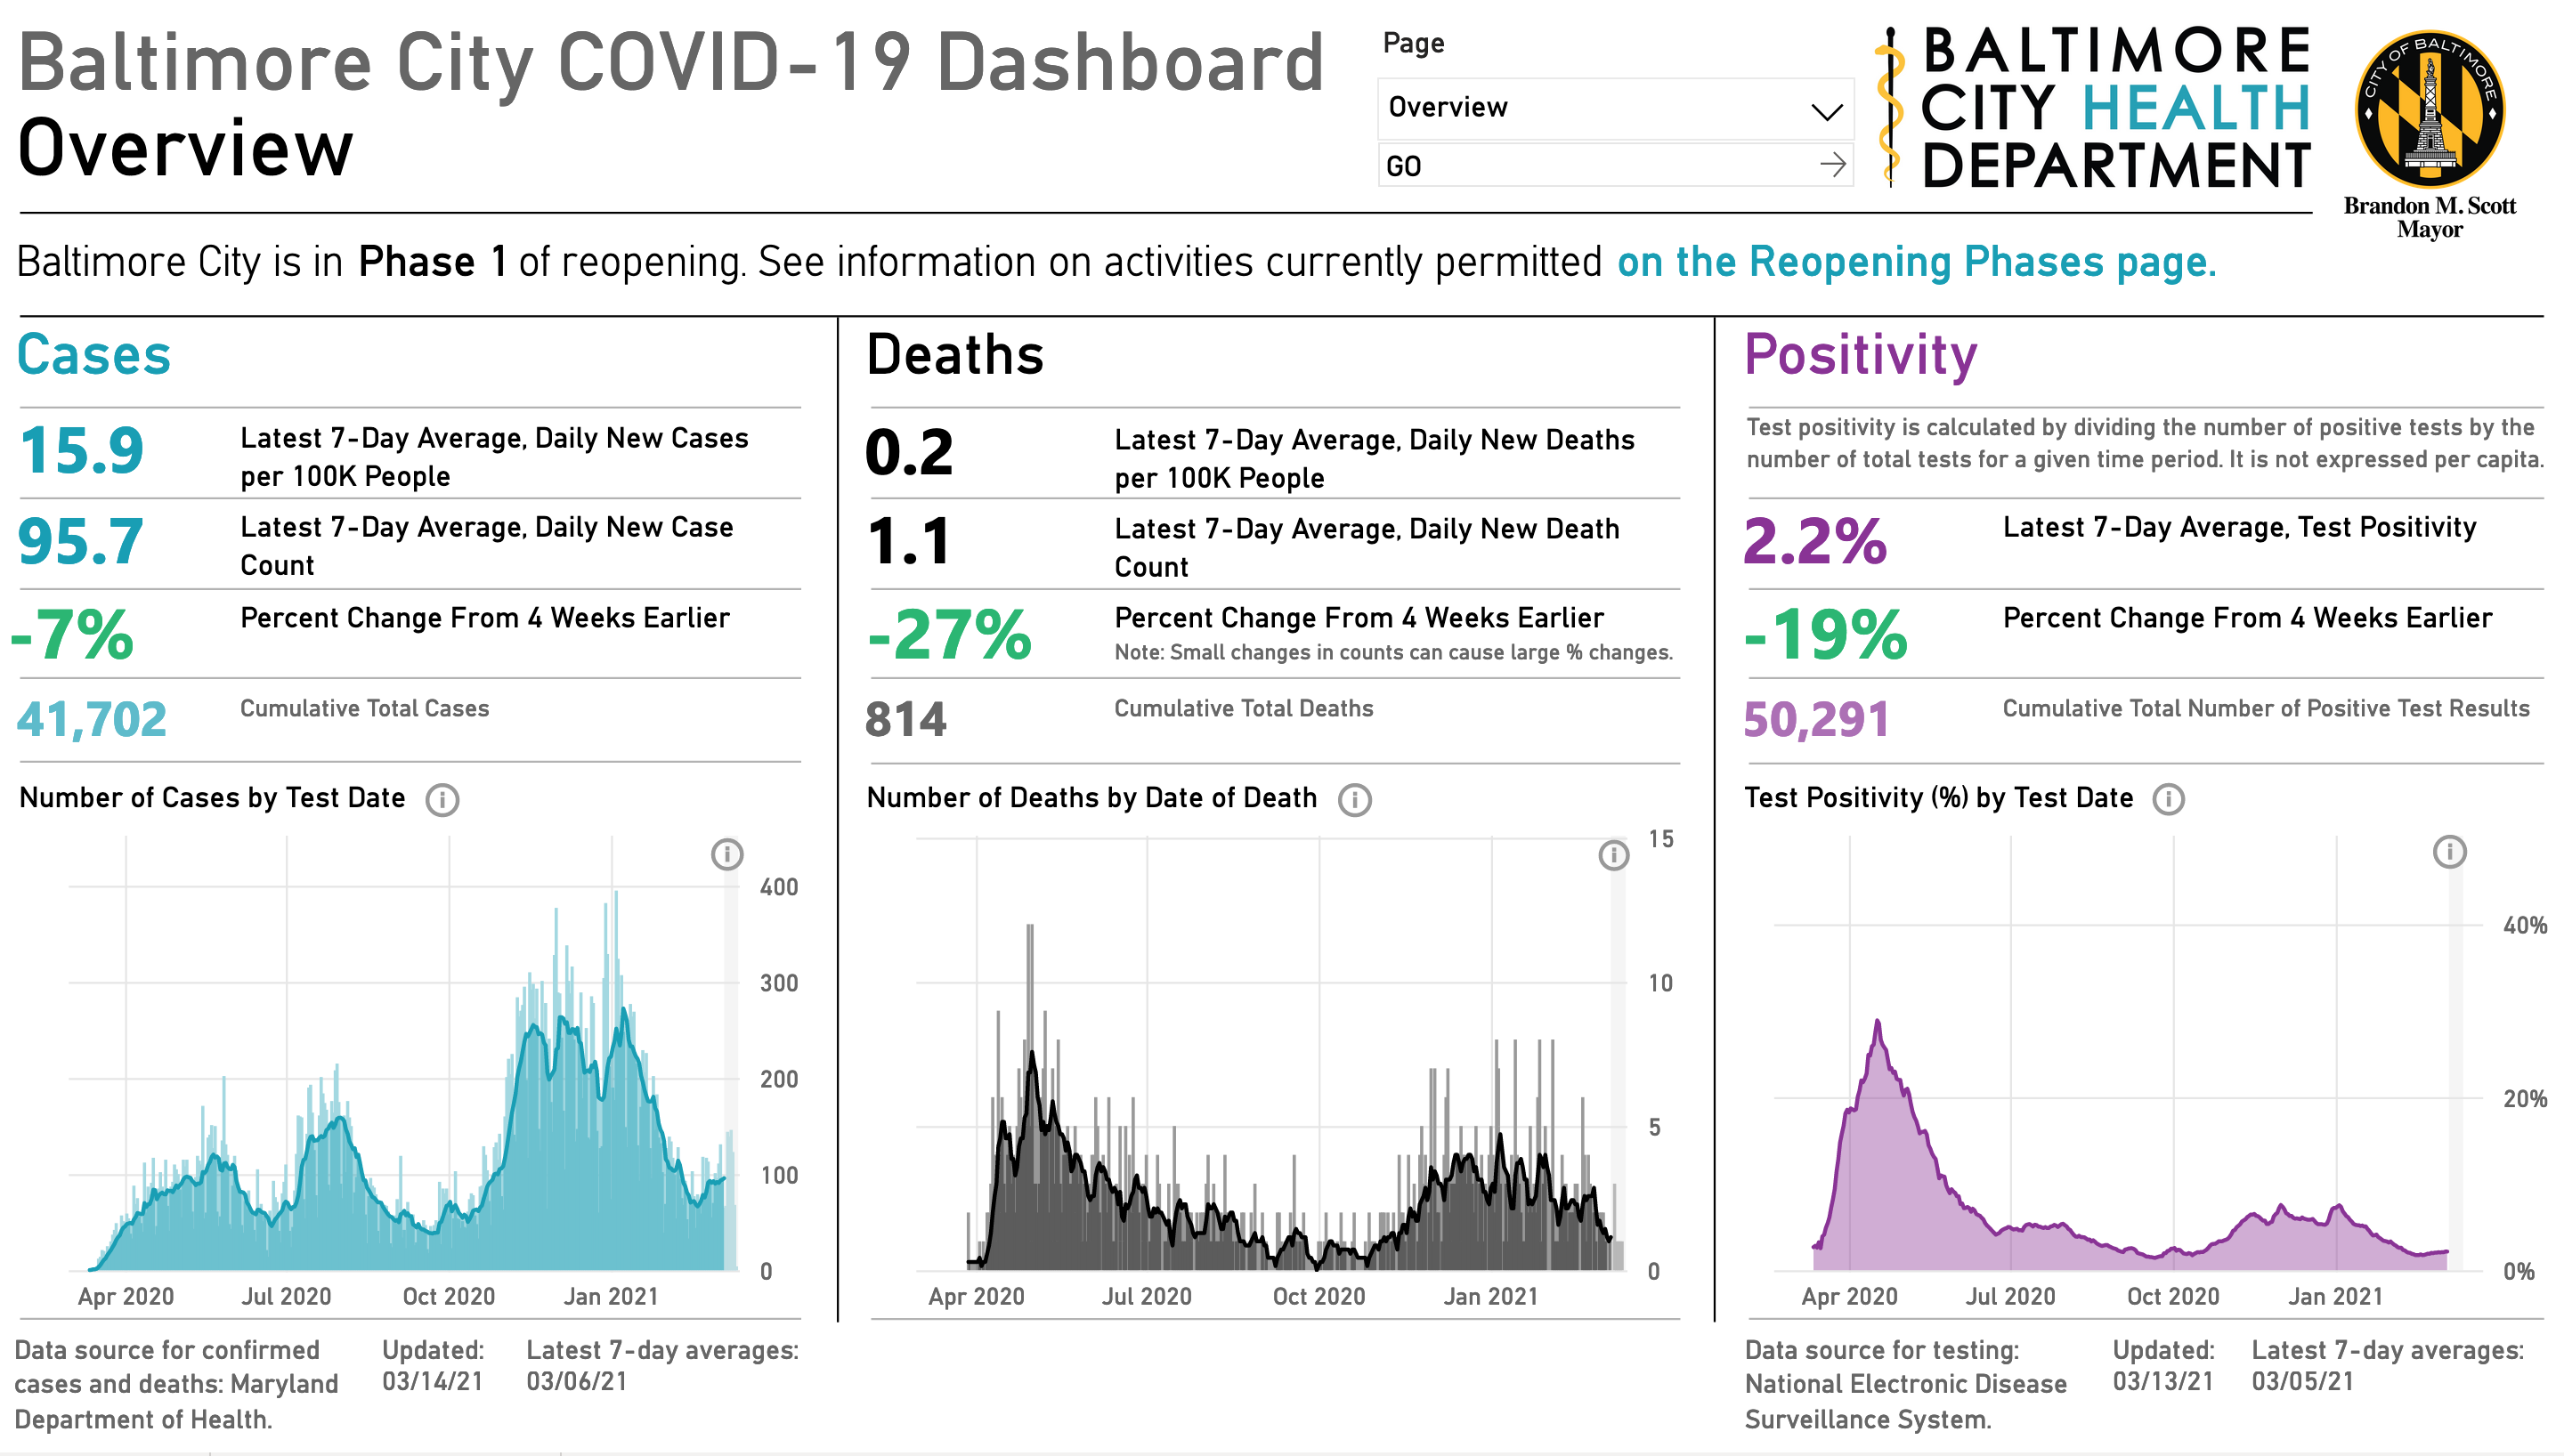
As a CitiStat analyst, I designed Baltimore City's COVID-19 dashboard in collaboration with the Health Department. Since launch in April 2020, I have maintained the dashboard, which has involved facilitating requirement gathering and user testing sessions, developing new features, and automating processes.
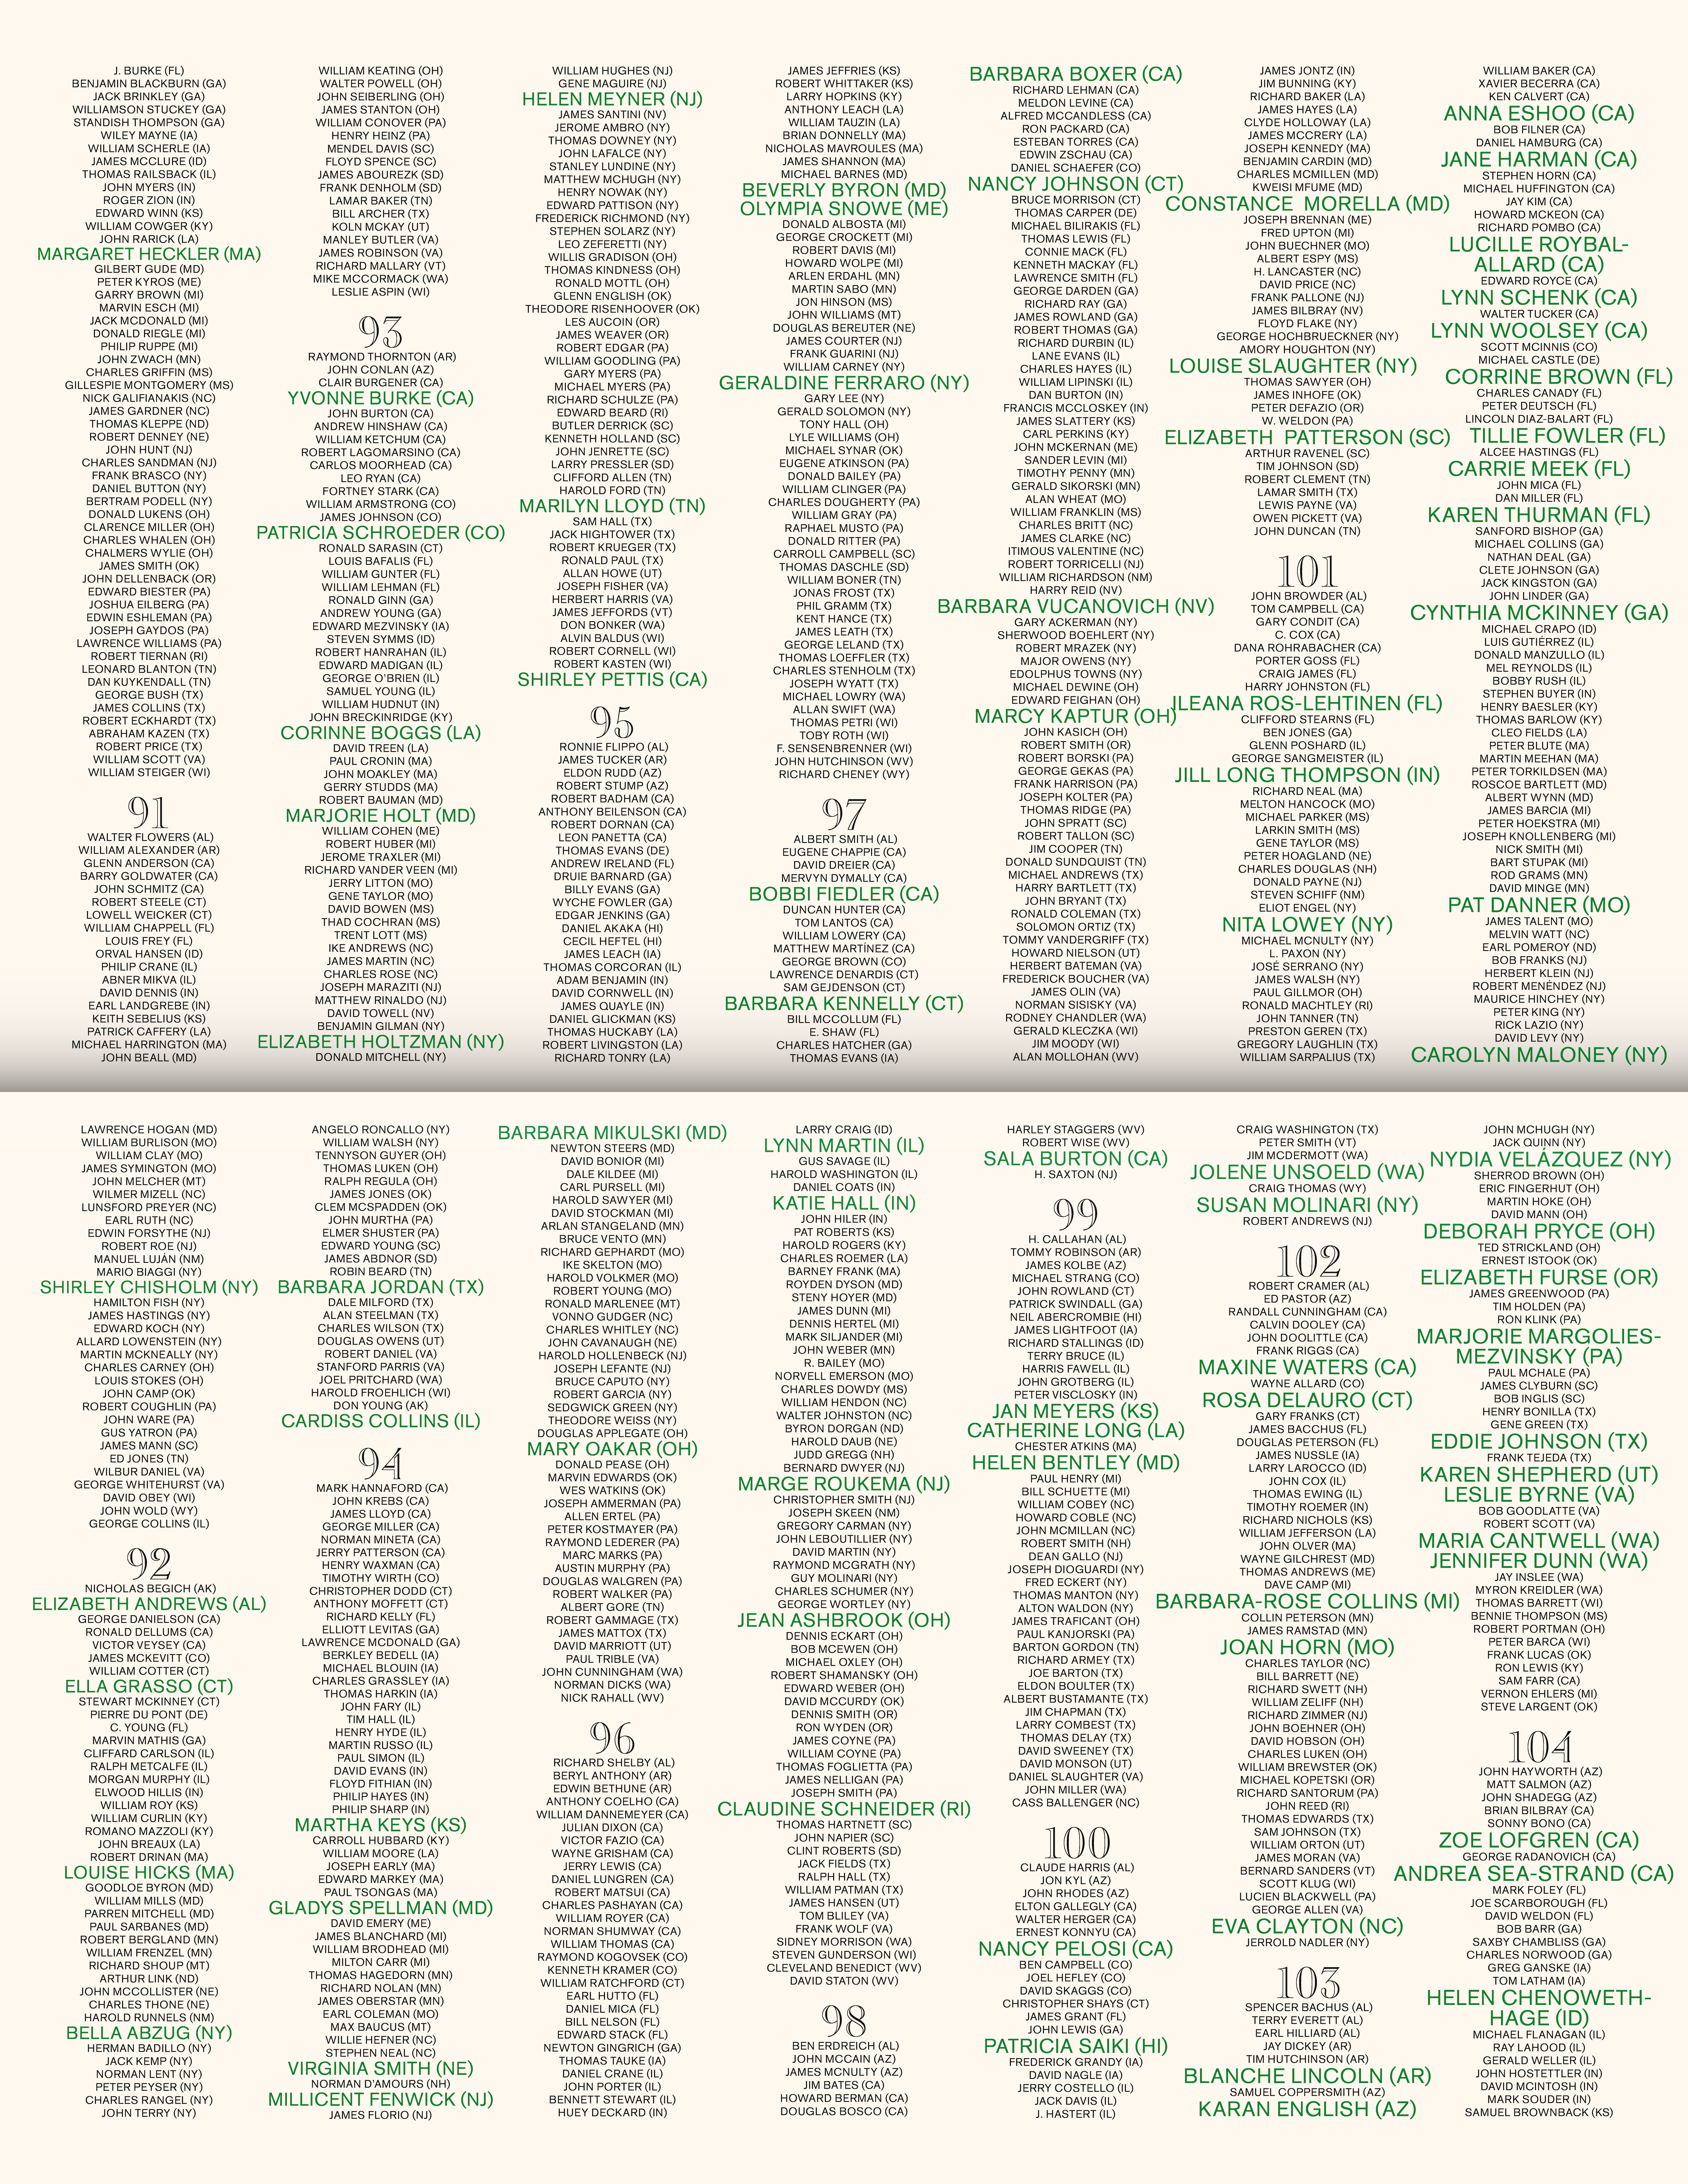
For a graphic design course in college, I designed this zine to celebrate the historic representation of women in the 116th Congress. The body of the zine lists the names of all U.S. representatives from the 1st to the 116th Congress.
As coordinator for the Duby Team at Compass, I designed print and online marketing materials in addition to managing client relations and marketing strategy for the agent team. Selected monthly print mailers shown here. See lead broker Evan Duby's page on Compass.
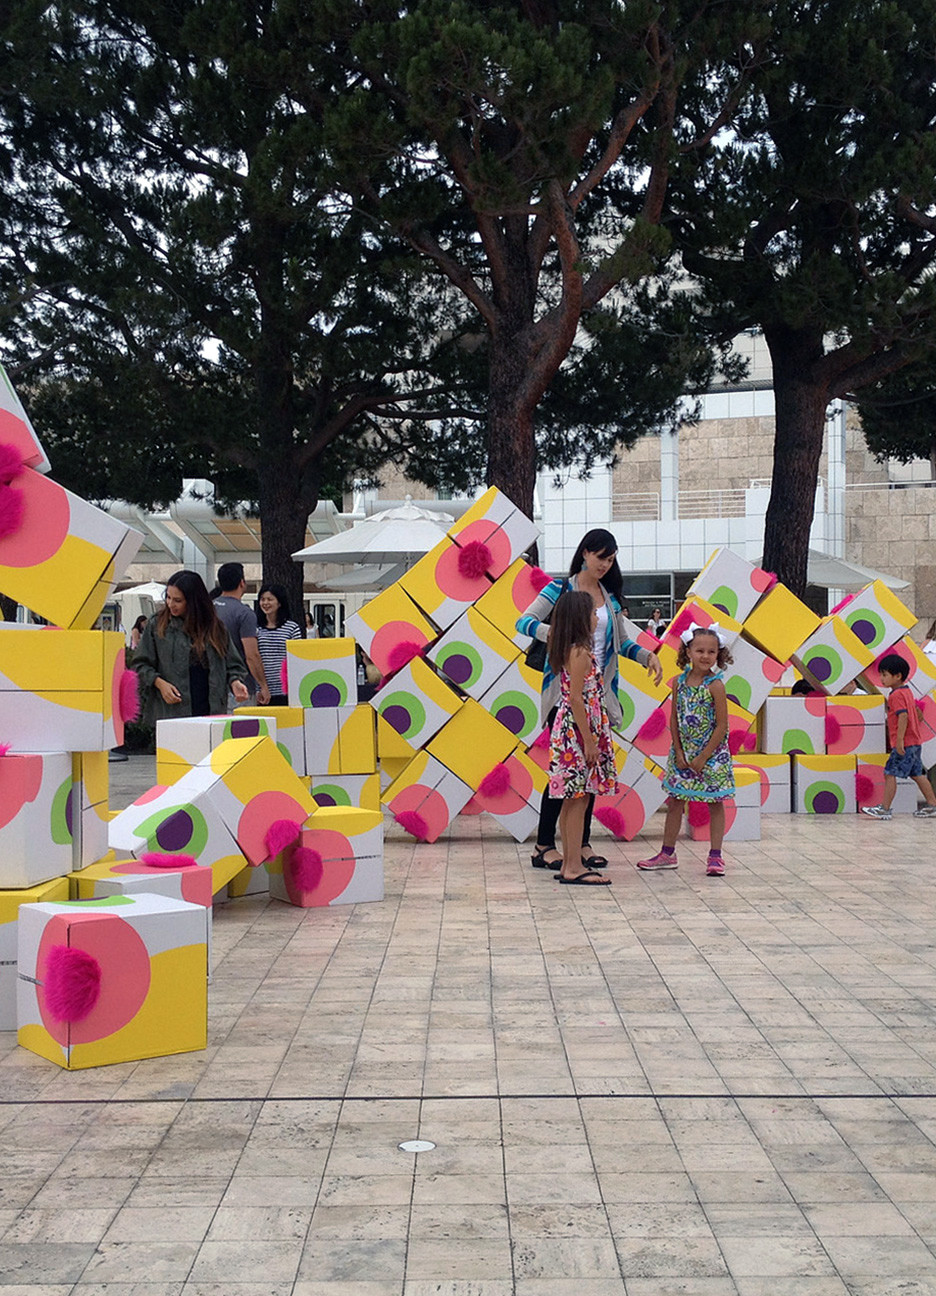
While interning at Predock_Frane architects, I helped design and fabricate Fuzzy Grids II, an interactive art installation at the Getty Center. See more information from The J. Paul Getty Museum.